KubeMQ Dashboard Upgrade + Webinar: Your Control Center for Microservices Connectivity
We are excited to announce the latest upgrade to the KubeMQ Dashboard, which transforms it into a comprehensive control center for managing microservices connectivity. This upgrade introduces two powerful features: auto-discovery and charts, providing you with real-time insights and visualization capabilities to streamline your microservices environment.
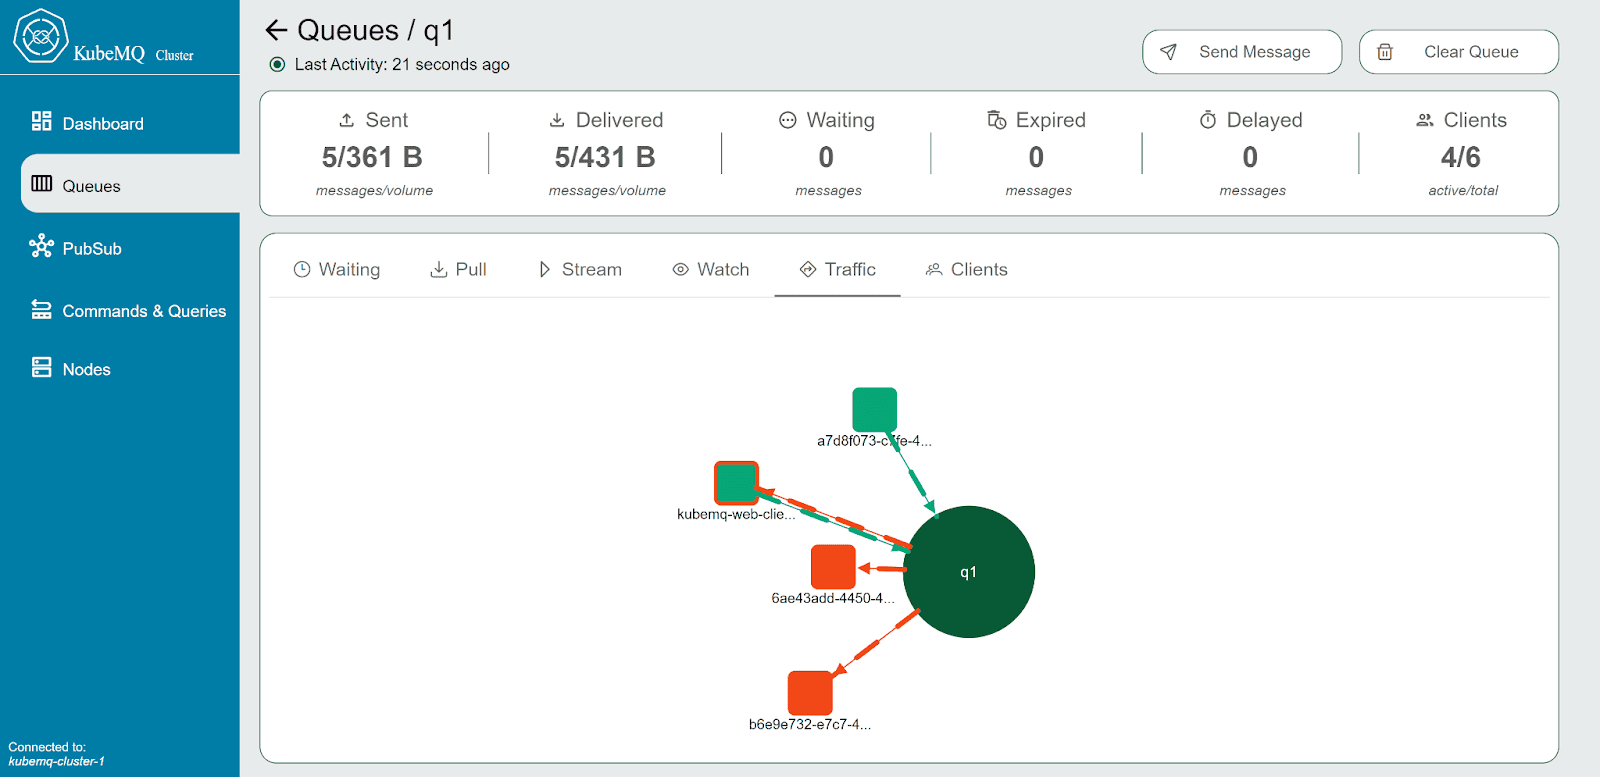
Auto-Discovery: Gain Real-Time Visibility
With the new auto-discovery feature, the KubeMQ Dashboard provides you with an intuitive and real-time view of your microservices connections. You can now easily identify which clients or connectors are connected as senders and receivers for each queue or channel. This granular visibility empowers you to quickly troubleshoot and optimize your messaging infrastructure.
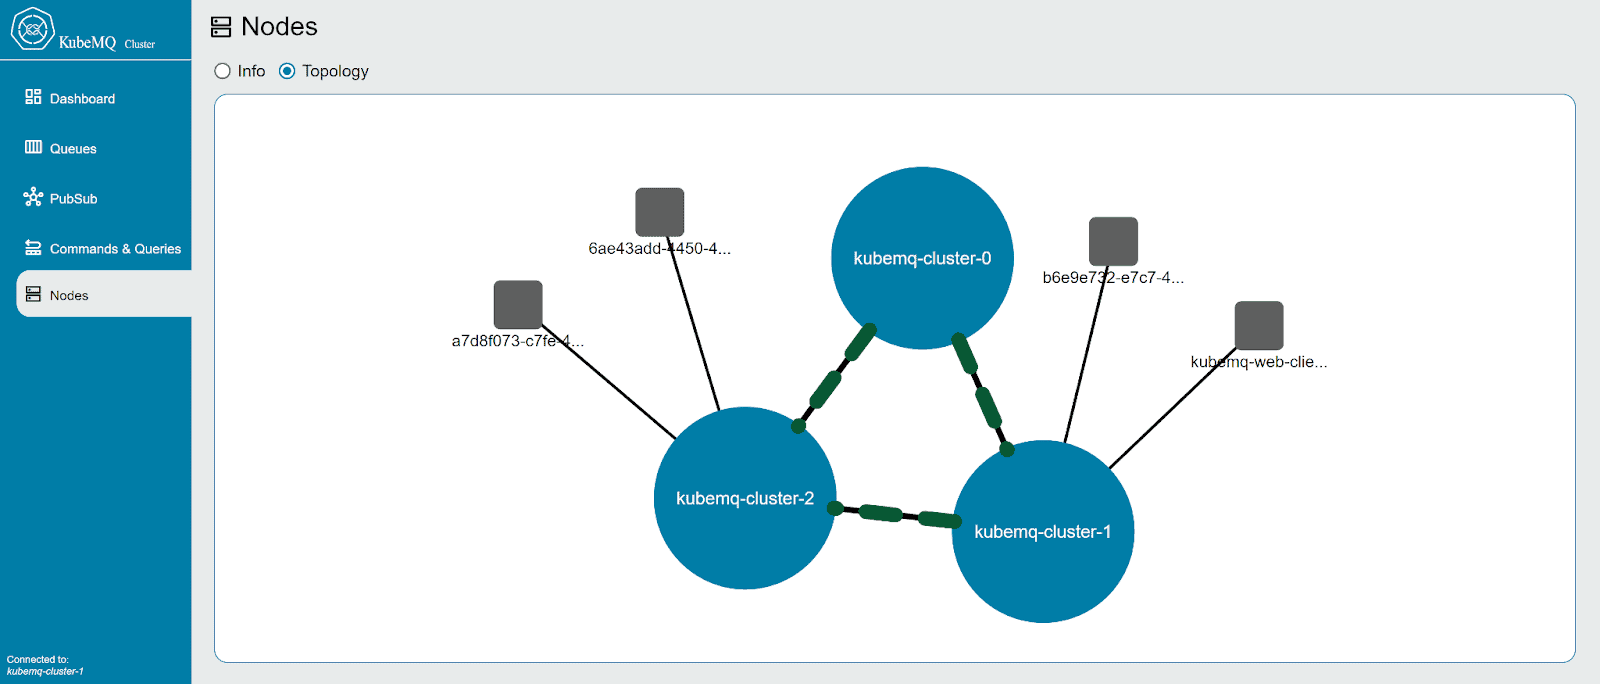
Furthermore, the auto-discovery feature enables you to identify which clients or connectors are connected to each node in the KubeMQ cluster. This detailed view allows you to monitor the workload efficiently across the cluster, ensuring optimal performance and scalability for your microservices architecture.
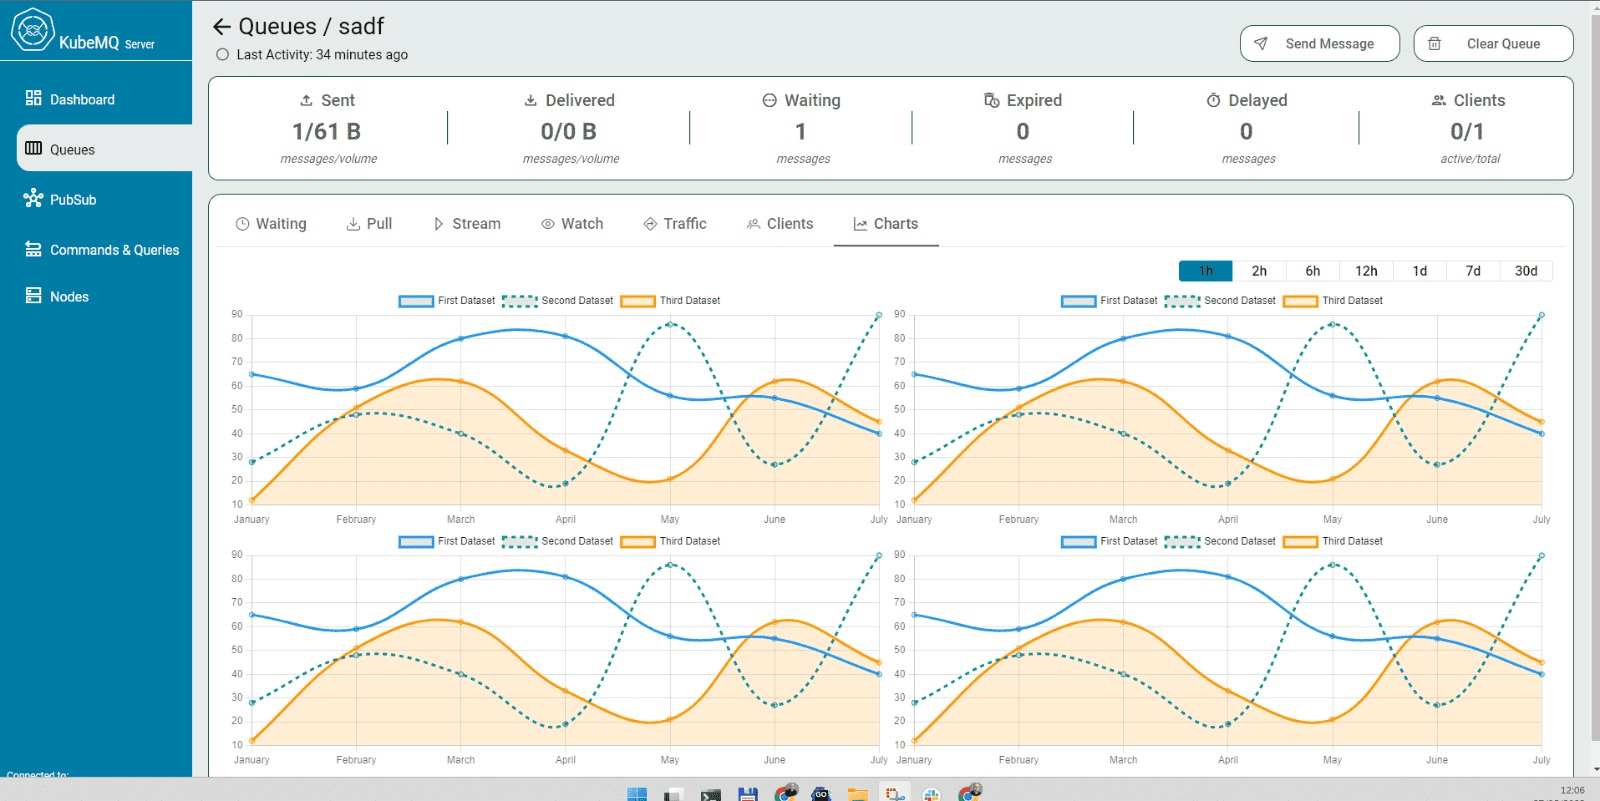
Charts: Visualize Messaging Activity
In addition to the powerful auto-discovery feature, the KubeMQ Dashboard now includes charts that provide valuable insights into your messaging activity over time. These charts display the number of messages and the volume of data flowing in and out of your microservices environment.
With the visualized data, you can easily track the performance trends of your microservices, identify potential bottlenecks, and make informed decisions to optimize your messaging infrastructure. The charts feature brings clarity and transparency to your microservices connectivity, allowing you to monitor and manage your system with ease.
Transforming KubeMQ into Your Microservices Control Center
This upgrade elevates the KubeMQ messaging platform to act as the ultimate control center for your microservices architecture. The simple and intuitive UI of the KubeMQ Dashboard, coupled with the auto-discovery and charts features, empowers you to streamline your microservices environment efficiently.
By leveraging the KubeMQ Dashboard as your control center, you can save time and development efforts, as well as simplify the process of setting up and managing your microservices infrastructure. Whether you are a developer, architect, or DevOps professional, this upgrade will revolutionize the way you manage and monitor your microservices connectivity.
Webinar Announcement: Learn How to Harness the Power of KubeMQ Dashboard
To help you make the most of the KubeMQ Dashboard upgrade, we are hosting a webinar on the 29 of June. During this webinar, our experts will showcase how you can effectively utilize the dashboard as your control center for microservices architecture.
Join us to discover the full potential of the KubeMQ Dashboard and learn how it can simplify your microservices management. Don’t miss this opportunity to gain valuable insights and enhance your microservices connectivity.
Register for the webinar to secure your spot and mark your calendar for the 29 of June.