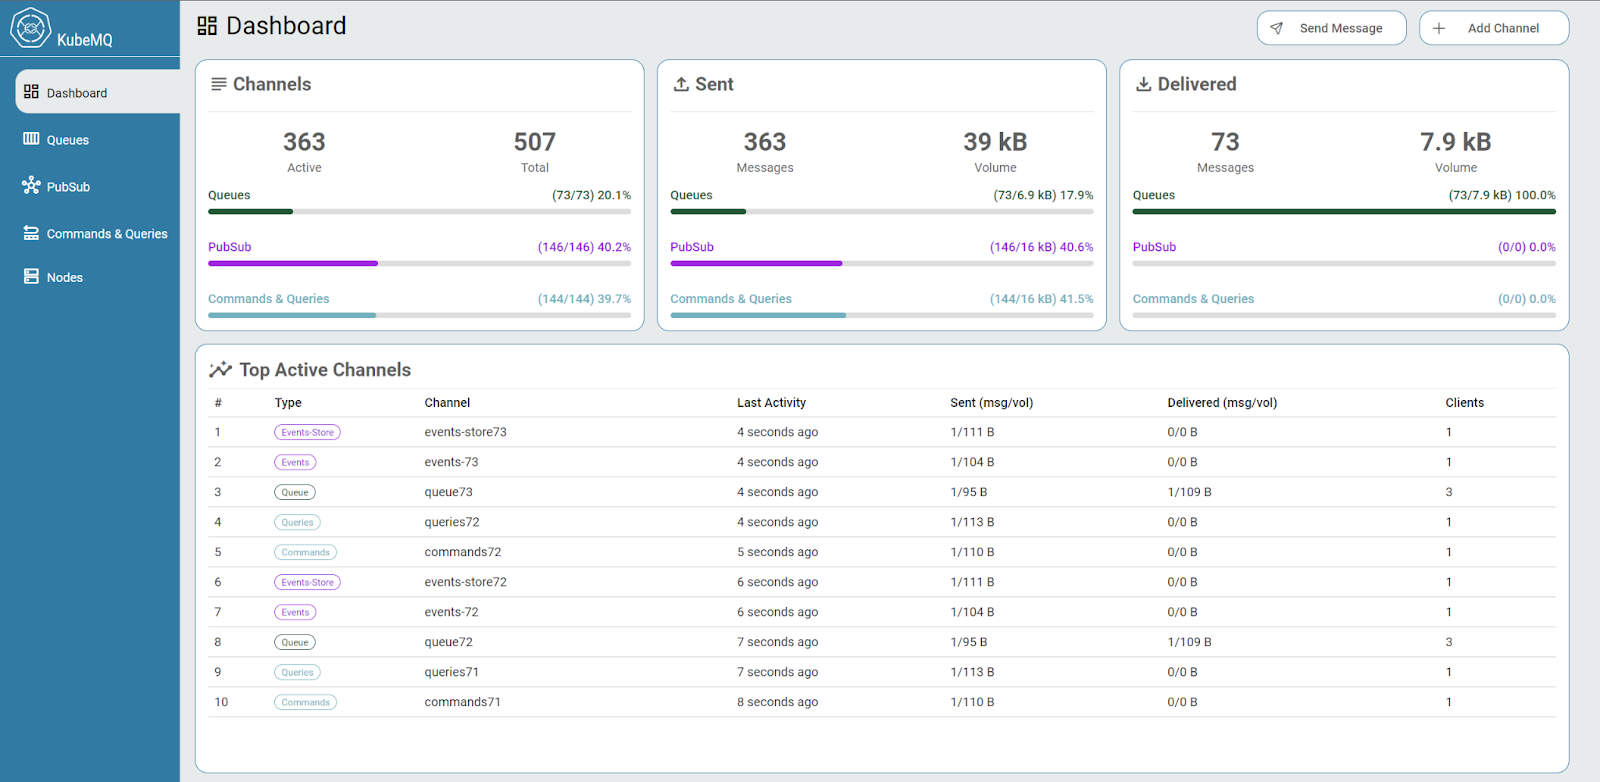
The KubeMQ Dashboard web interface enables users to experience the power of KubeMQ messaging patterns without writing code. It allows users to monitor and handle all message traffic and view the status of all KubeMQ nodes.
After KubeMQ is installed, launch KubeMQ Dashboard at localhost:8080/dashboard
Main features of the KubeMQ Dashboard web interface:
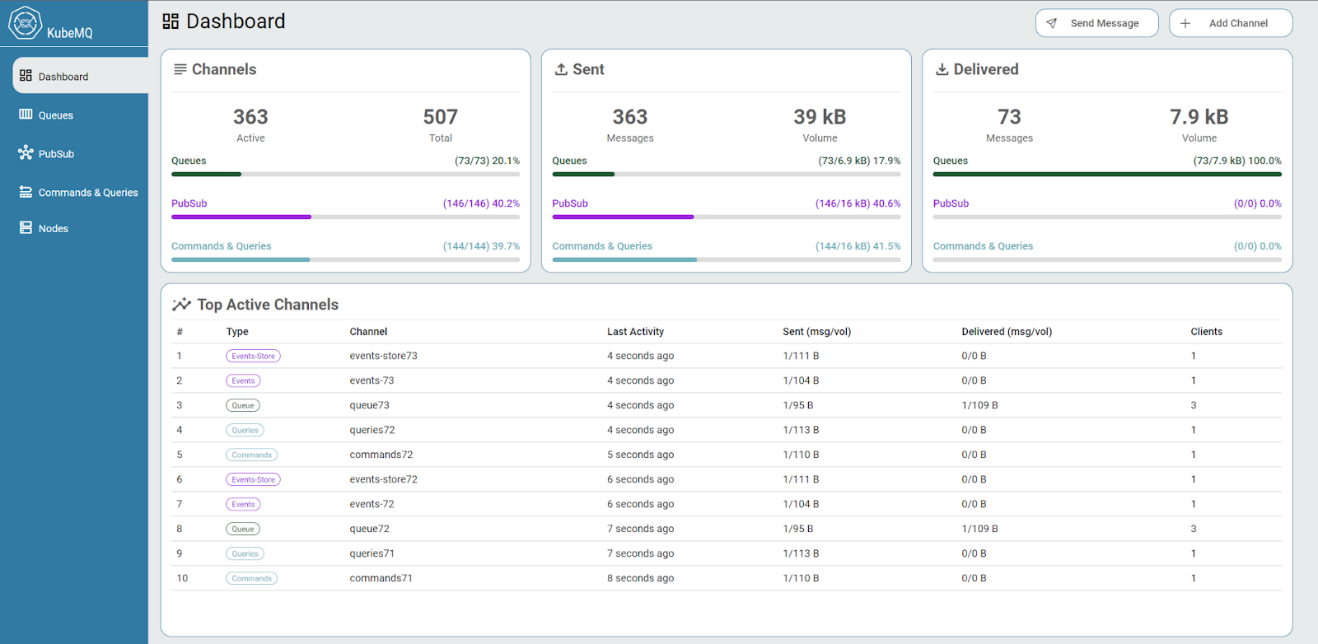
Dashboard
Get a clear picture of KubeMQ message traffic in one view
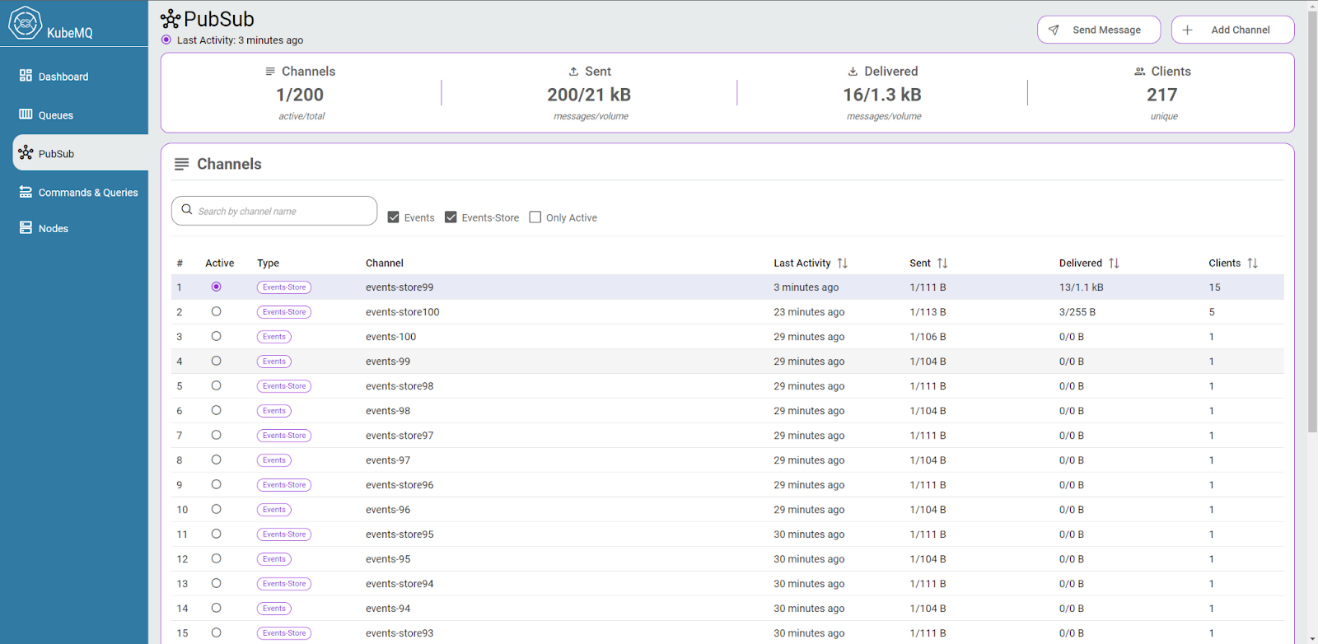
Messaging view (Queues/PubSub/Command&Queries)
Manage and control messages easily by drilling down to each messaging pattern.
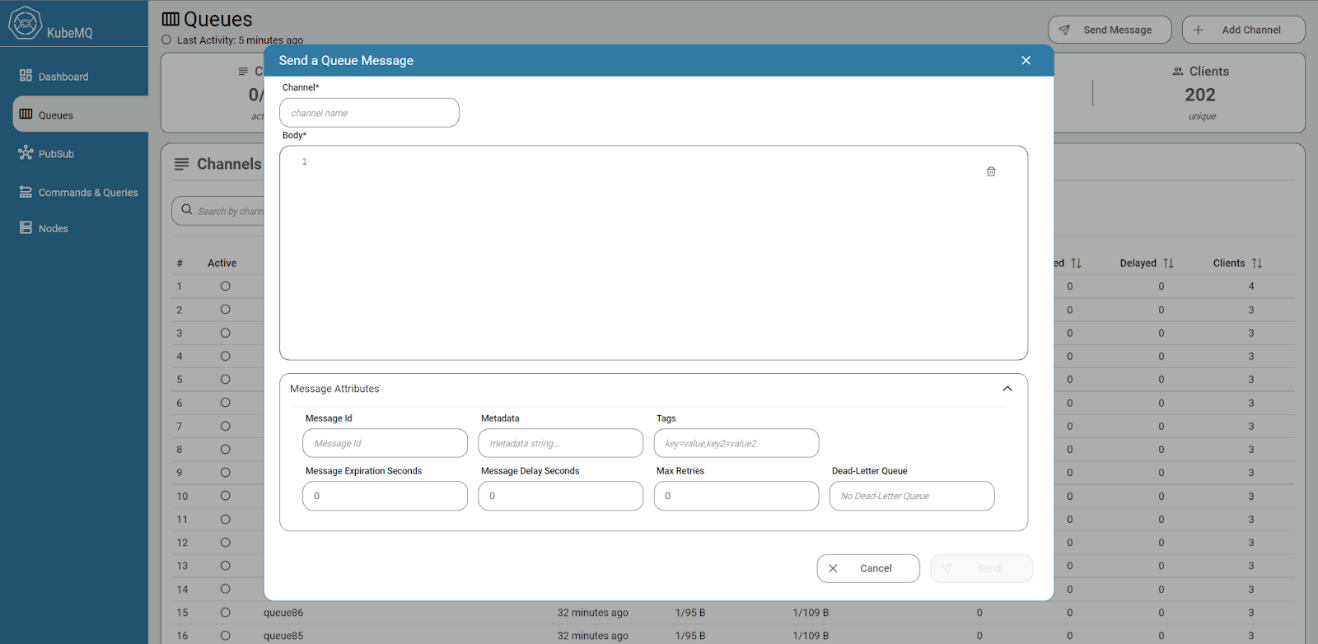
Send messages instantly
Using the KubeMQ Dashboard, you can send messages through a simple interface. This allows you to get familiar with messaging patterns and their capabilities without having to write a line of code.
Nodes
View KubeMQ nodes status