Control Center
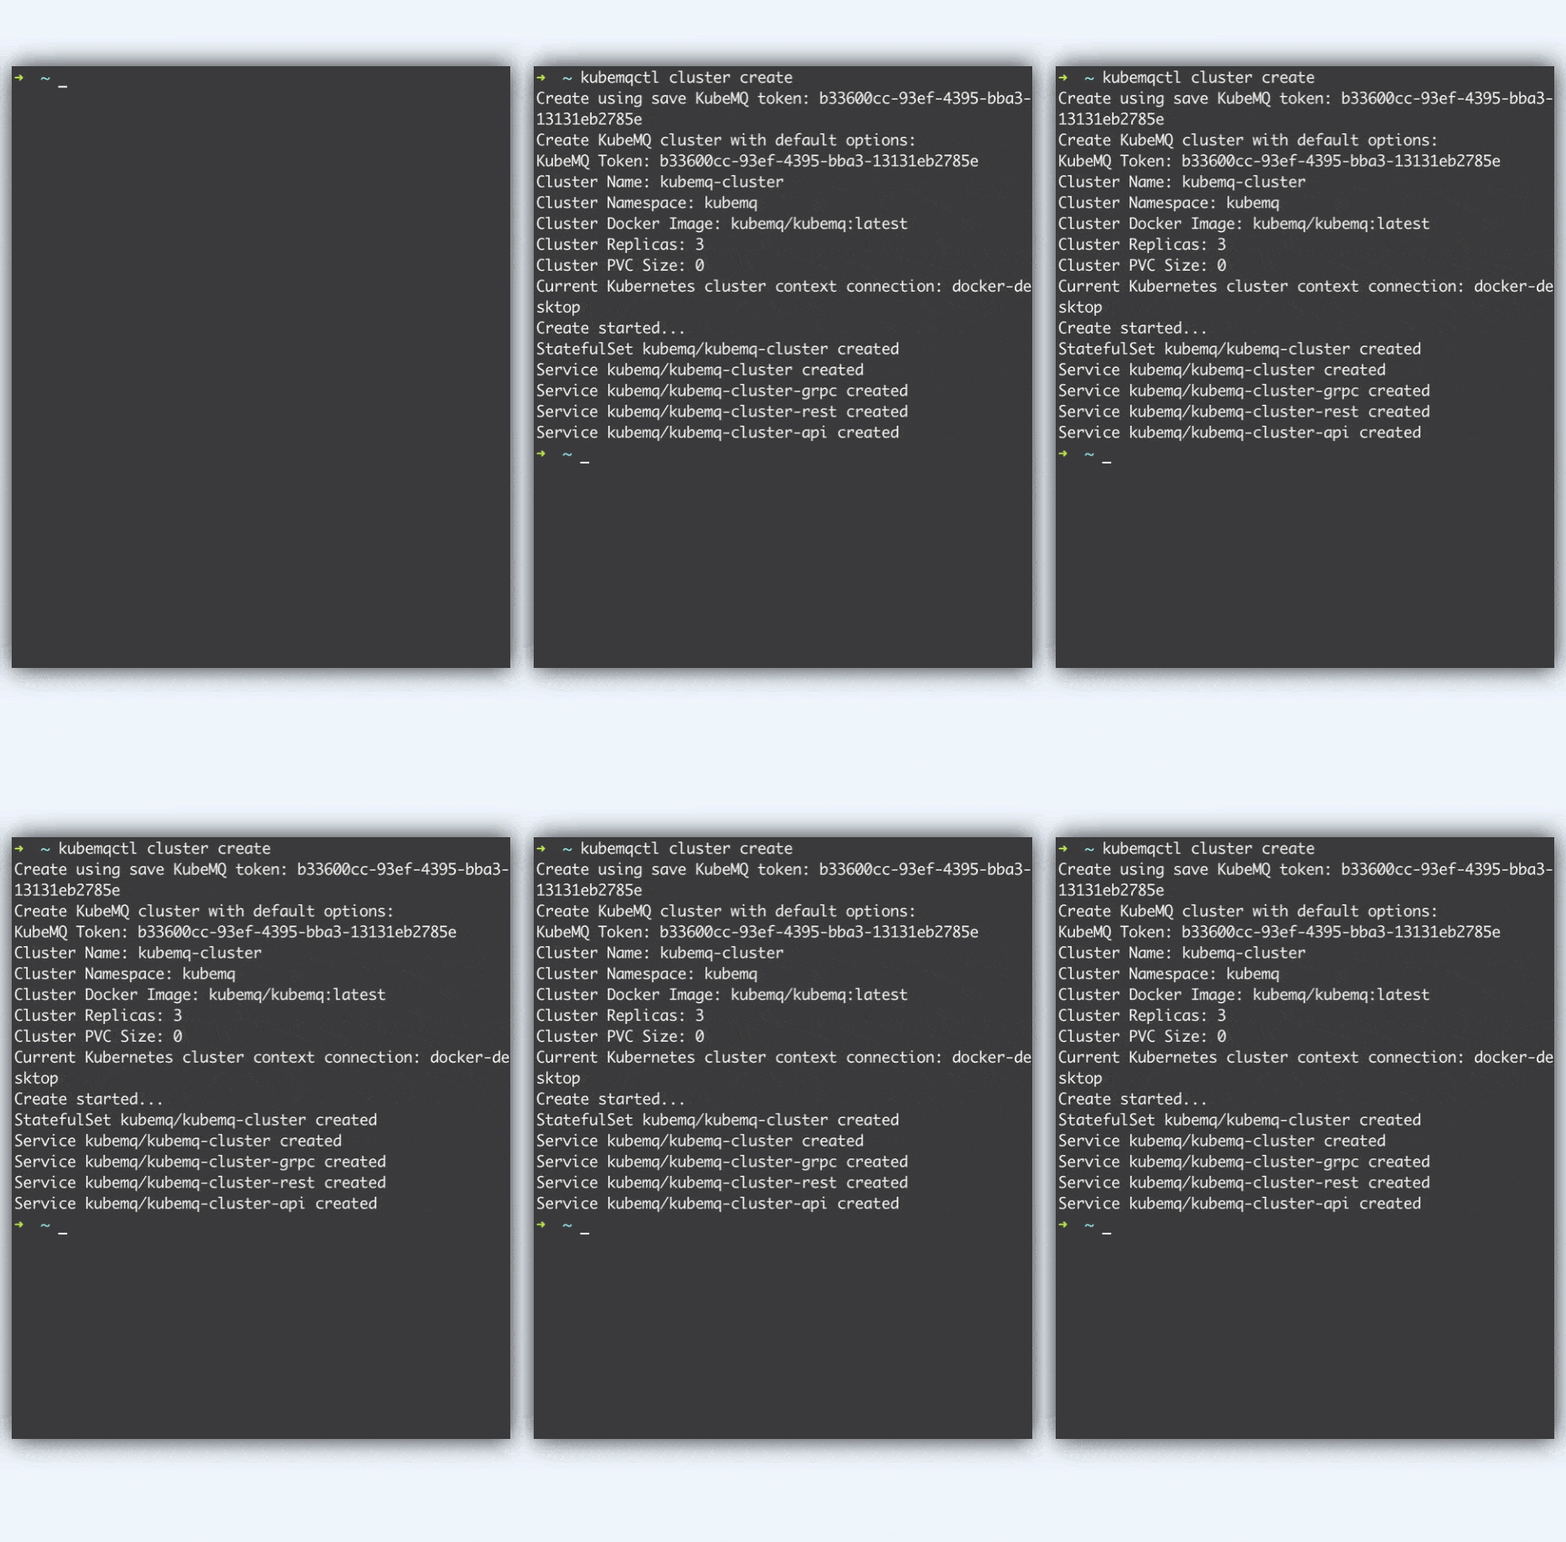
Manage, control, and monitor the KubeMQ platform. The control center includes a pre-configured Grafana/Prometheus dashboard and an enhanced CLI tool.
divider
Dashboard
Enhanced view of all metrics
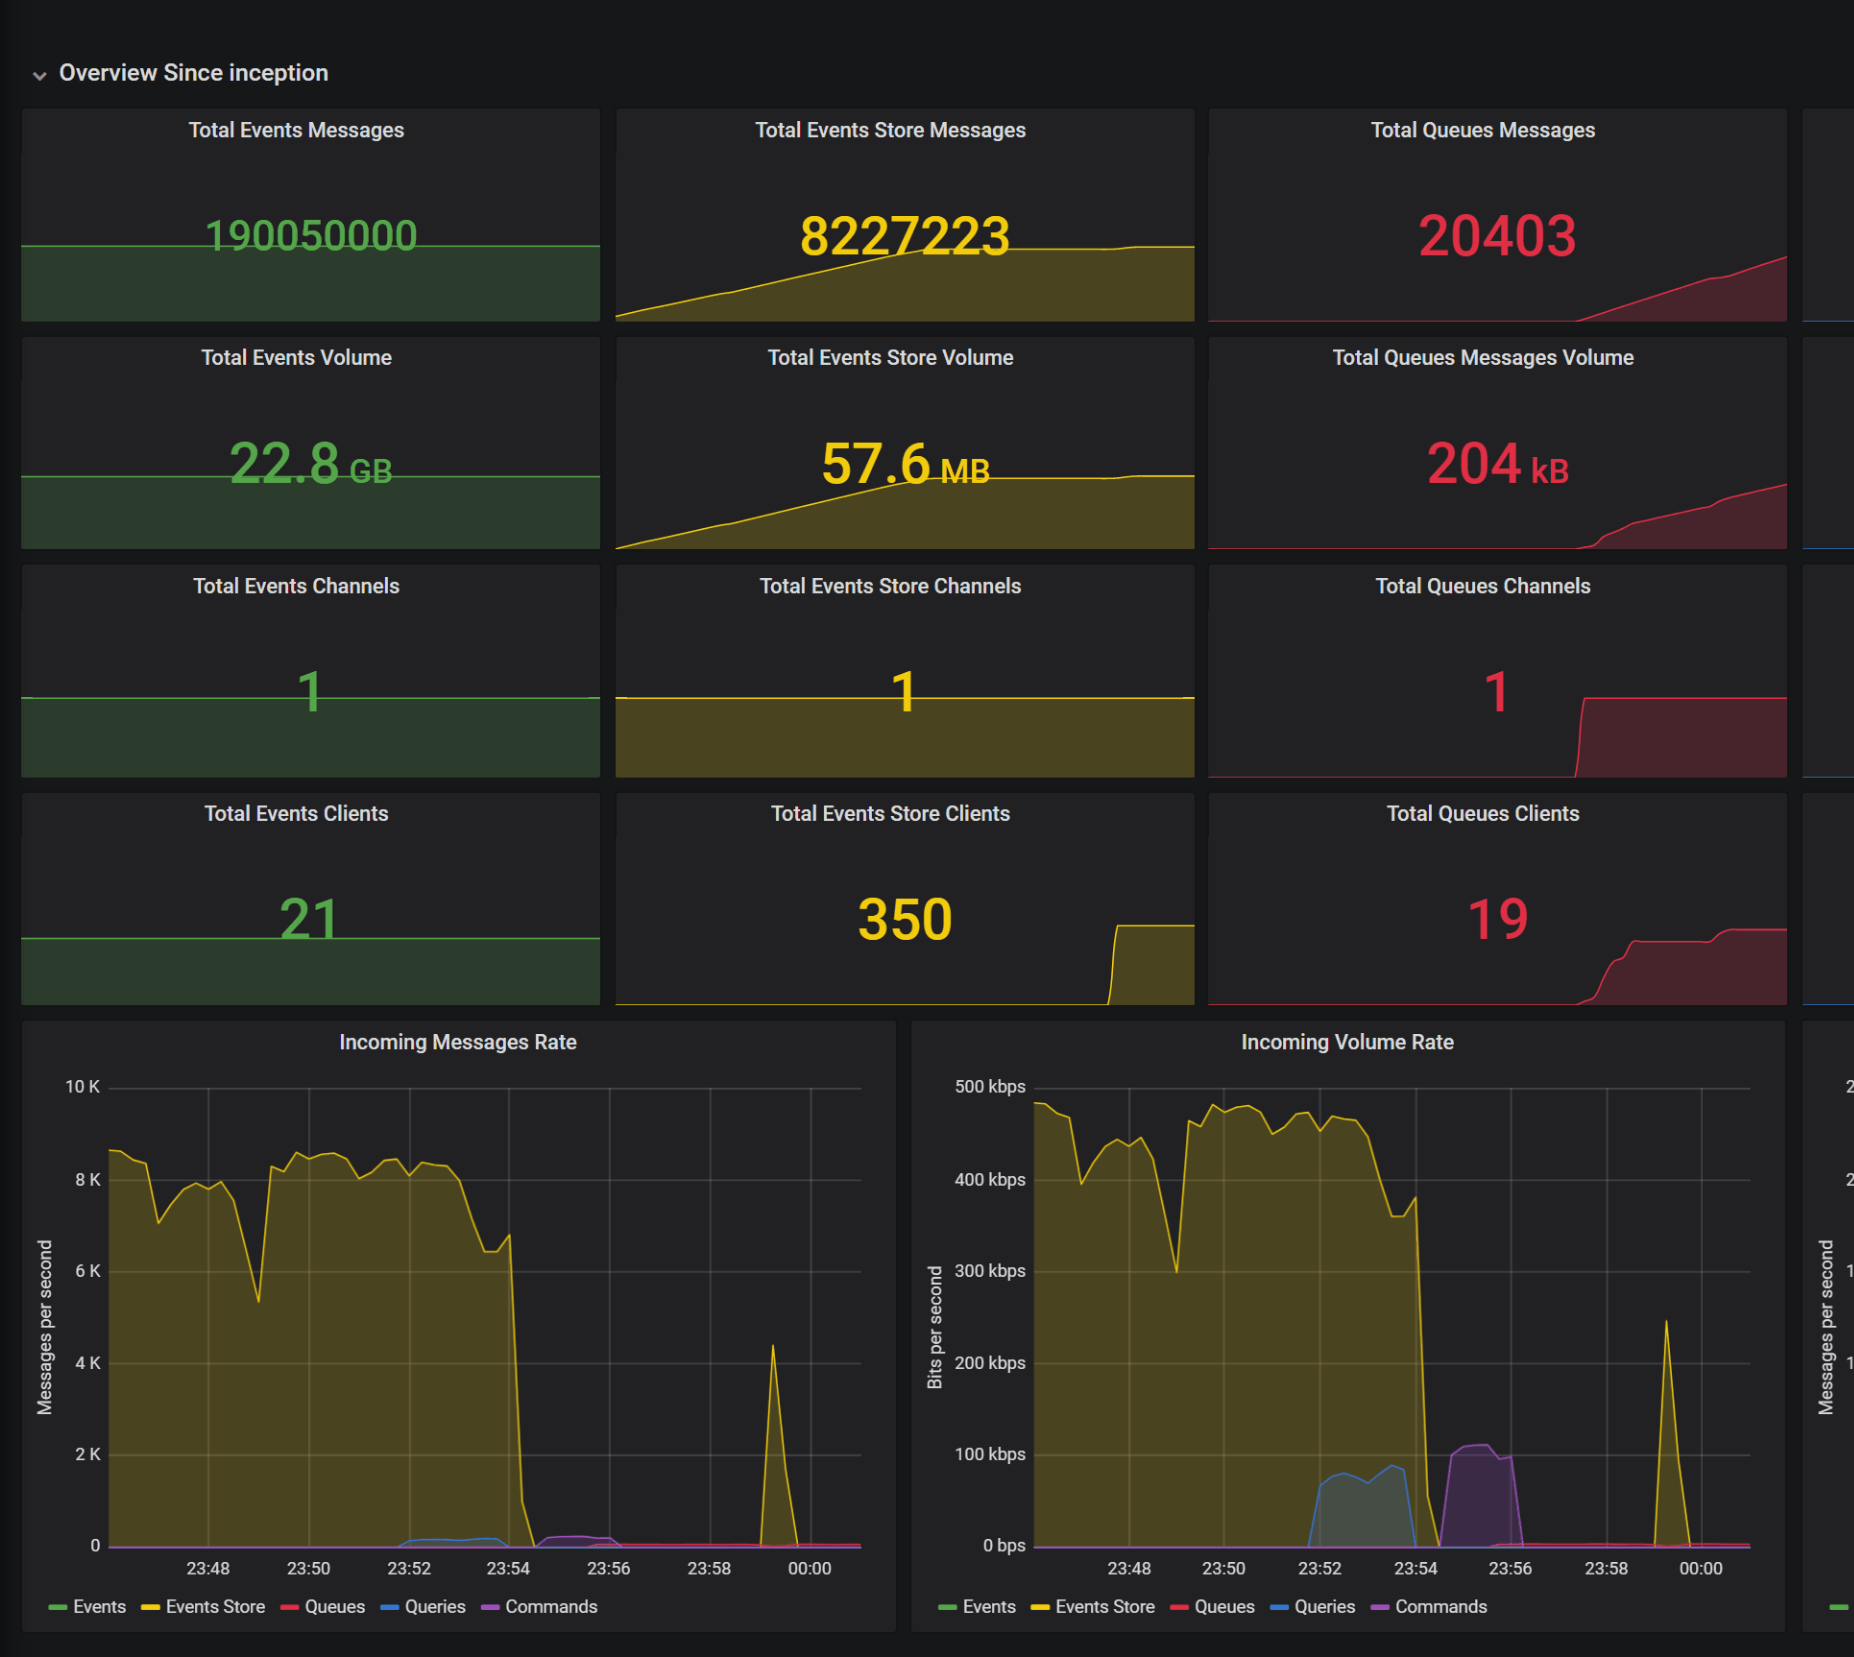
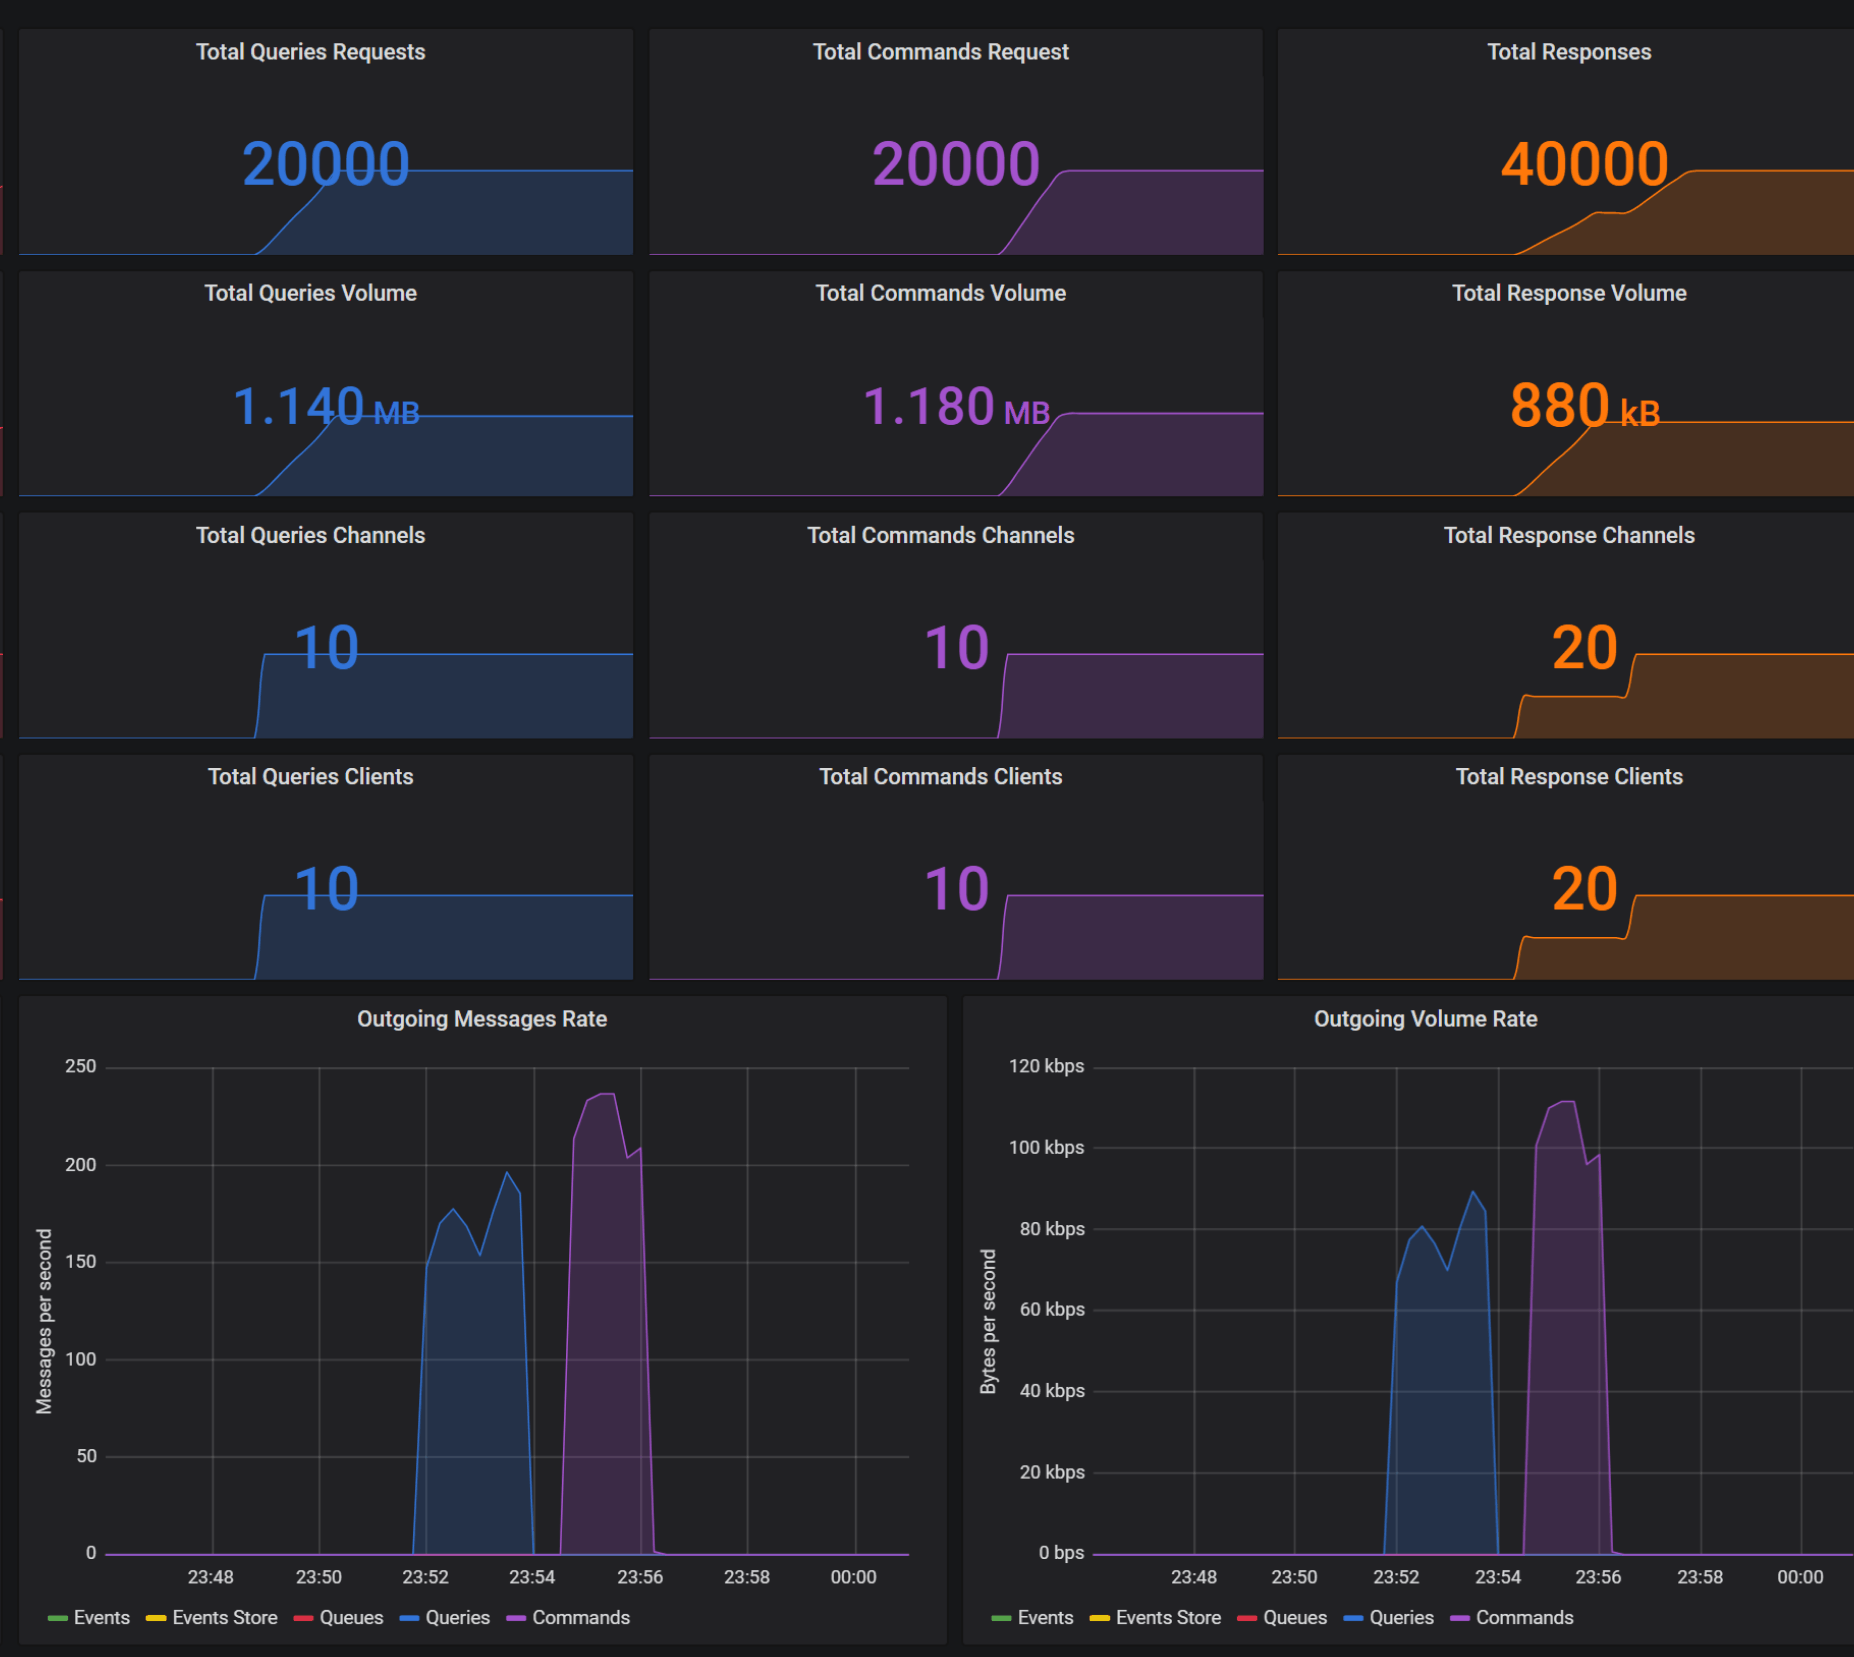
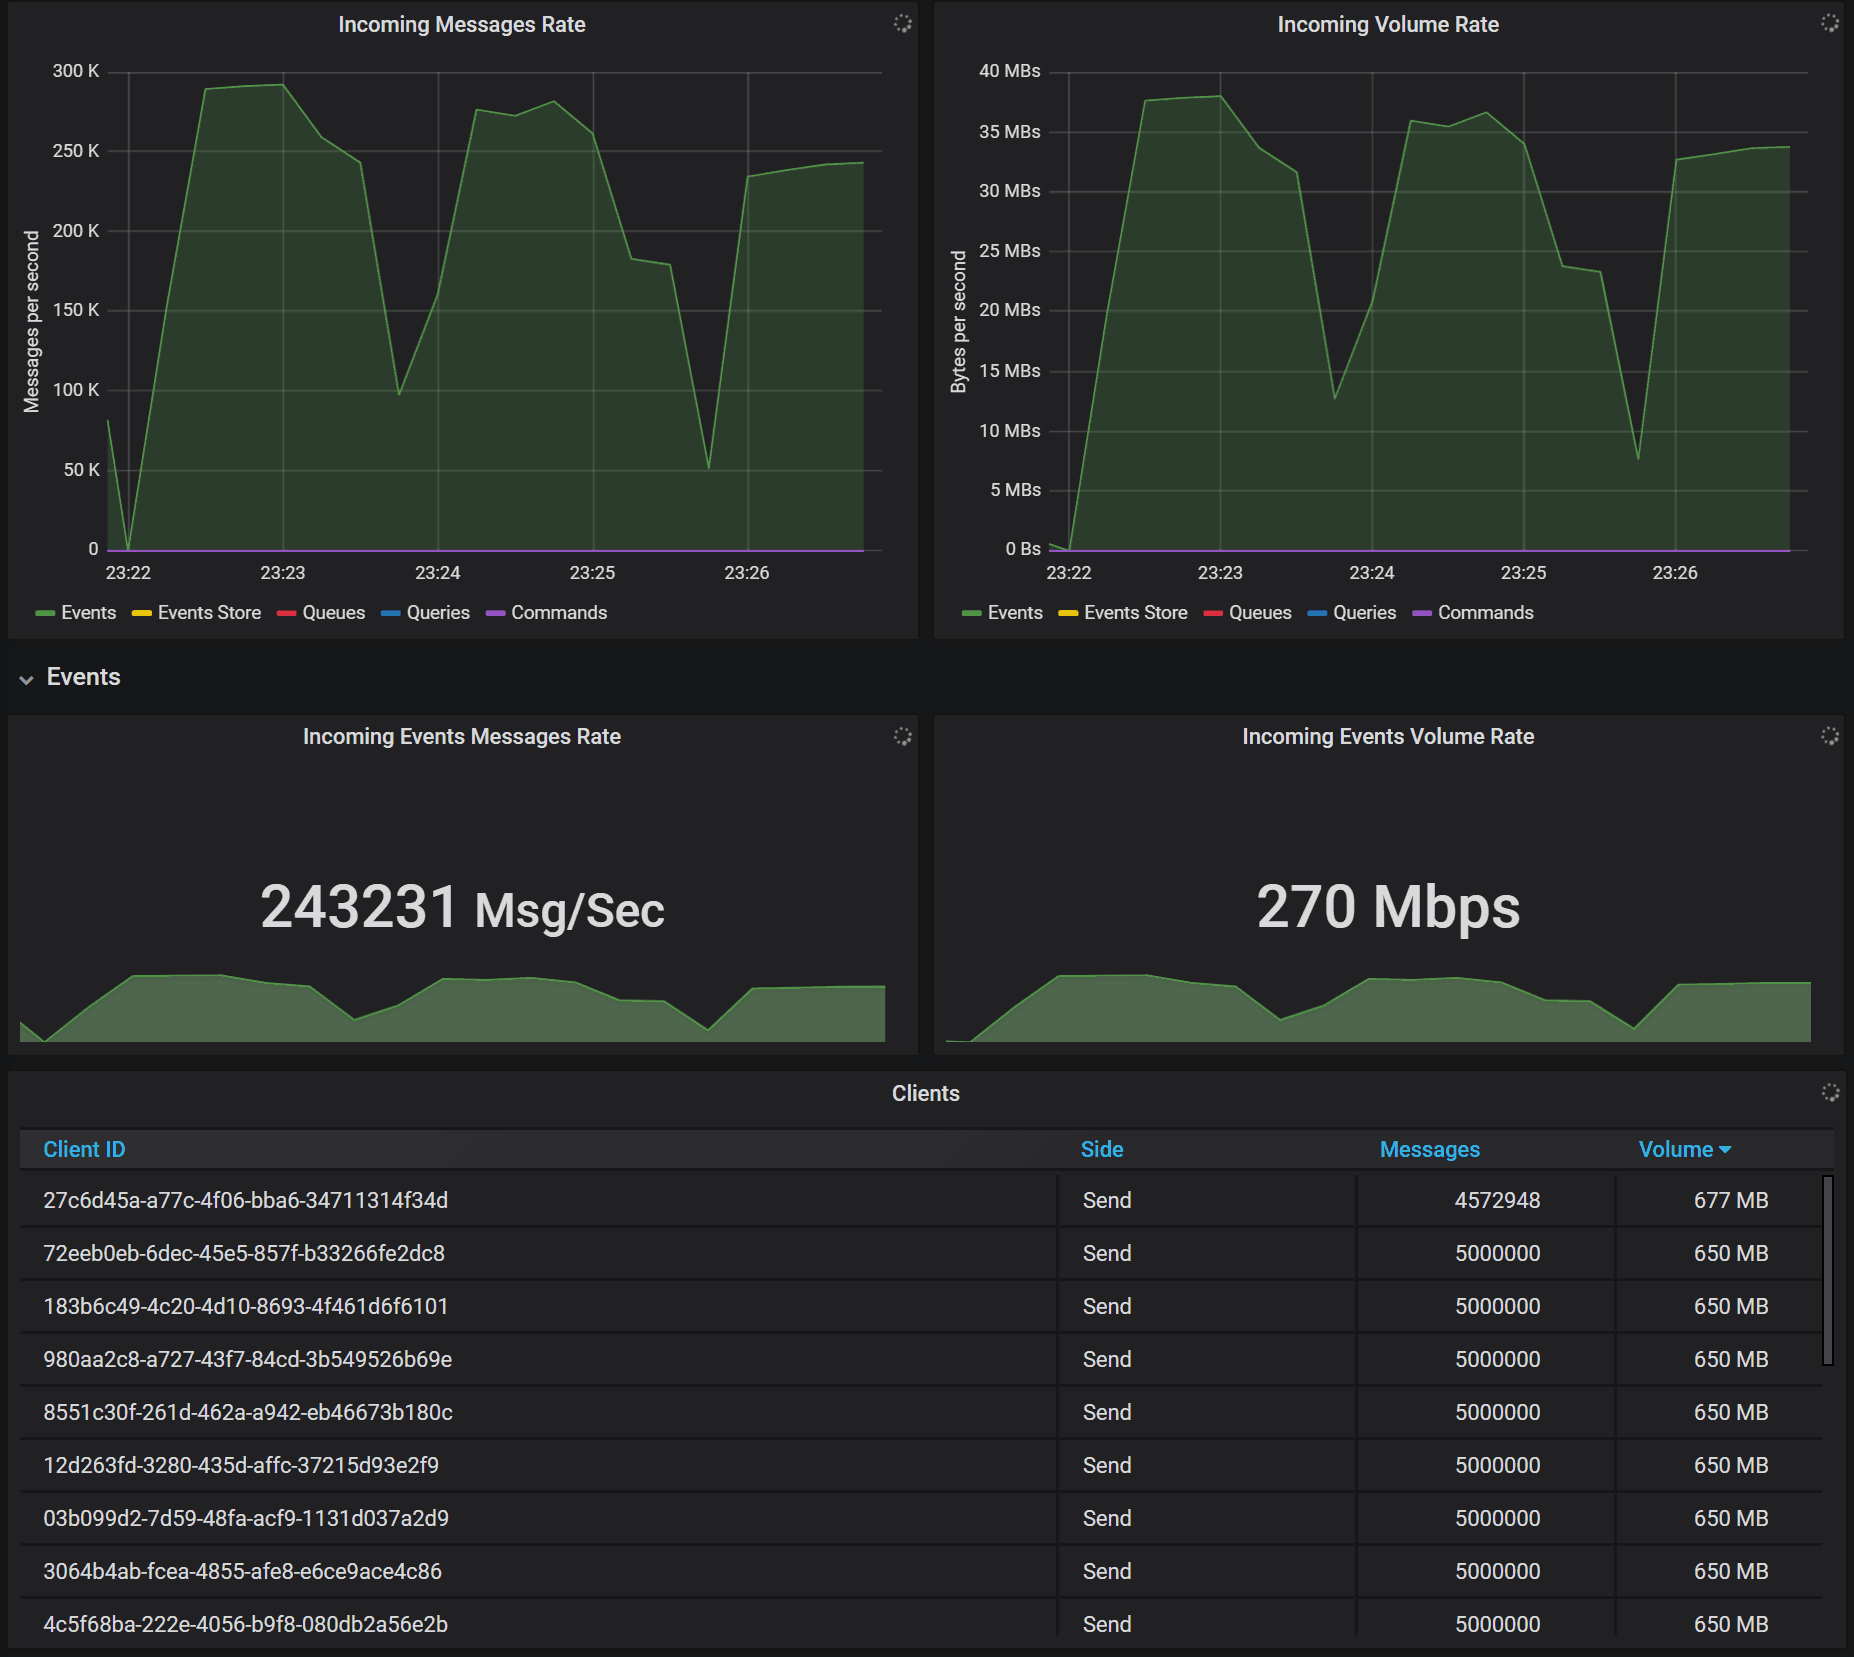
- Control view and monitor all messaging activity through one central dashboard.
- Kubemq exports the following metrics: messages count, messages volume, messages errors, and clients.
- Message pattern view for incoming/outgoing message and volume rate.
